First published on https://www.elastic.co/blog/creating-frozen-indices-with-the-elasticsearch-freeze-index-api
First, some context
Hot-Warm architectures are often used when we want to get the most out of our hardware. It is particularly useful when we have time-based data, like logs, metrics, and APM data. Most of these setups rely on the fact that this data is read-only (after ingest) and that indices can be time(or size)-based. So they can be easily deleted based on our desired retention period. In this architecture, we categorize Elasticsearch nodes into two types: ‘hot’ and ‘warm’.
Hot nodes hold the most recent data and thus handle all indexing load. Since recent data is usually the most frequently queried, these nodes will be the most powerful in our cluster: fast storage, high memory and CPU. But that extra power gets expensive, so it doesn’t make sense to store older data that isn’t queried as often on a hot node.
On the other hand, warm nodes will be the ones dedicated to long-term storage in a more cost-efficient way. Data on the warm nodes is not as likely to be queried often and data within the cluster will move from hot to warm nodes based on our planned retention (achieved through shard allocation filtering), while still being available online for queries.
Starting with Elastic Stack 6.3, we’ve been building new features to enhance hot-warm architectures and simplify working with time-based data.
Data rollups were first introduced in version 6.3, to save storage. In time-series data, we want fine-grained detail for the most recent data. But it is very unlikely that we will need the same for historical data, where we will typically look at datasets as a whole. And this is where rollups came in, since starting at version 6.5 we can create, manage and visualize rollup data in Kibana.
Shortly after, we added source-only snapshots. These minimal snapshots will provide a significant reduction of snapshot storage, with the tradeoff of having to reindex data if we want to restore and query. This has been available since version 6.5.
In version 6.6, we released two powerful features, Index Lifecycle Management (ILM) and Frozen Indices.
ILM provides the means to automate your indices management over time. It simplifies moving indices from hot to warm, allows deletion when indices are too old, or automates force merging indices down to one segment.
And for the rest of this blog, we’ll talk about frozen indices.
Why freeze an index?
One of the biggest pain points with “old” data is that, regardless of age, indices still have a significant memory footprint. Even if we place them on cold nodes, they still use heap.
A possible solution could be to close the index. If we close an index, it won’t require memory, but we will need to re-open it to run a search. Reopening indices will incur an operational cost and also require the heap it was using before being closed.
On each node, there is a memory (heap) to storage ratio that will limit the amount of storage available per node. It may vary from as low as 1:8 (memory:data) for memory intensive scenarios, to something close to 1:100 for less demanding memory use cases.
This is where frozen indices come in. What if we could have indices that are still open — keeping them searchable — but do not occupy heap? We could add more storage to data nodes that hold frozen indices, and break the 1:100 ratio, understanding the tradeoff that searches might be slower.
When we freeze an index, it becomes read-only and its transient data structures are dropped from memory. In turn, when we run a query on frozen indices, we will have to load the data structures to memory. Searching a frozen index doesn’t have to be slow. Lucene heavily depends on the filesystem cache which might have enough capacity to retain significant portions of your index in memory. In such a case searches are comparable in speed per shard. Yet, a frozen index is still throttled such that only one frozen shard is executing per node at the same time. This aspect might slow down searches compared to unfrozen indices.
How freezing works
Frozen indices are searched through a dedicated, searched-throttled threadpool. This by default uses a single thread, to ensure that frozen indices are loaded into memory one at a time. If concurrent searches are happening, they will get in the queue to add additional protections to prevent nodes from running out of memory.
So, in a hot-warm architecture, we will now be able to transition indices from hot to warm, and then be able to freeze them before archiving or deleting them, allowing us to reduce our hardware requirements.
Before frozen indices, to reduce infrastructure cost we had to snapshot and archive our data, which adds a significant operational cost. We would have to restore data if we needed to search again. Now, we can keep our historical data available for search, without a significant memory overhead. And if we need to write again on an already froze index, we can just unfreeze it.
How to freeze an Elasticsearch index
Frozen indices are easy to implement in your cluster, so let’s get started on how to use the Freeze index API and how to search on frozen indices.
First, we’ll start by creating some sample data on a test index.
POST /sampledata/_doc
{
    "name": "Jane",
    "lastname": "Doe"
}
POST /sampledata/_doc
{
    "name": "John",
    "lastname": "Doe"
}
And then check that our data has been ingested. This should return two hits:
GET /sampledata/_search
As a best practice, before you freeze an index it’s recommended to first run a force_merge. This will ensure that each shard has only a single segment on disk. It will also provide much better compression and simplifies the data structures we will need when running an aggregation or a sorted search request on the frozen index. Running searches on a frozen index with multiple segments can have a significant performance overhead up to multiple orders of magnitude.
POST /sampledata/_forcemerge?max_num_segments=1
The next step is to just invoke a freeze on our index via the Freeze index API endpoint.
POST /sampledata/_freeze
Searching Frozen Indices
Now that it’s frozen, you’ll see that regular searches won’t work. The reason for this is that, to limit memory consumption per node, frozen indices are throttled. Since we could target a frozen index by mistake, we’ll prevent accidental slowdowns by specifically adding ignore_throttled=false to the request.
GET /sampledata/_search?ignore_throttled=false
{
  "query": {
    "match": {
      "name": "jane"
    }
  }
}
Now we can check the status of our new index, by running the following request:
GET _cat/indices/sampledata?v&h=health,status,index,pri,rep,docs.count,store.size
This will return a result similar to the following, with the index status being ‘open’:
health status index      pri rep docs.count store.size
green  open   sampledata   5   1          2     17.8kb
As mentioned above, we must protect the cluster from running out of memory, thus there is a limit in the number of frozen indices we can concurrently load for search on a node. The number of threads in the search-throttled threadpool defaults to 1, with a default queue of 100. This means that if we run more than one request, they will be queued up to a hundred. We can monitor the threadpool status, to check queues and rejections, with the following request:
GET _cat/thread_pool/search_throttled?v&h=node_name,name,active,rejected,queue,completed&s=node_name
Which should return a response similar to:
node_name             name             active rejected queue completed
instance-0000000000   search_throttled      0        0     0        25
instance-0000000001   search_throttled      0        0     0        22
instance-0000000002   search_throttled      0        0     0         0
Frozen indices might be slower, but they can be pre-filtered in a very efficient manner. It is also recommended to set the request parameter pre_filter_shard_size to 1.
GET /sampledata/_search?ignore_throttled=false&pre_filter_shard_size=1
{
 "query": {
   "match": {
     "name": "jane"
   }
 }
}
This will not add a significant overhead to the query and will allow us to take advantage of the usual scenario. For example, when searching on a date range on time-series indices, not all shards will match.
How to write to a frozen Elasticsearch index
What will happen if we try to write on an already frozen index? Let’s go for it and find out.
POST /sampledata/_doc
{
  "name": "Janie",
  "lastname": "Doe"
}
What happened? Frozen indices are read-only, so writing is blocked. We can check these in the index settings:
GET /sampledata/_settings?flat_settings=true
Which will return:
{
 "sampledata" : {
   "settings" : {
     "index.blocks.write" : "true",
     "index.frozen" : "true",
     ....
   }
 }
}
We have to use the Unfreeze index API, invoking the unfreeze endpoint on the index.
POST /sampledata/_unfreeze
And now we’ll be able to create a third document and search for it.
POST /sampledata/_doc
{
 "name": "Janie",
 "lastname": "Doe"
}
GET /sampledata/_search
{
 "query": {
   "match": {
     "name": "janie"
   }
 }
}
Unfreezing should be done only under exceptional situations. And remember to always run a `force_merge` before freezing the index again to ensure optimal performance.
Using frozen indices in Kibana
To begin with, we will need to load some sample data, like the sample flight data.
Click on the “Add” button for Sample flight data.
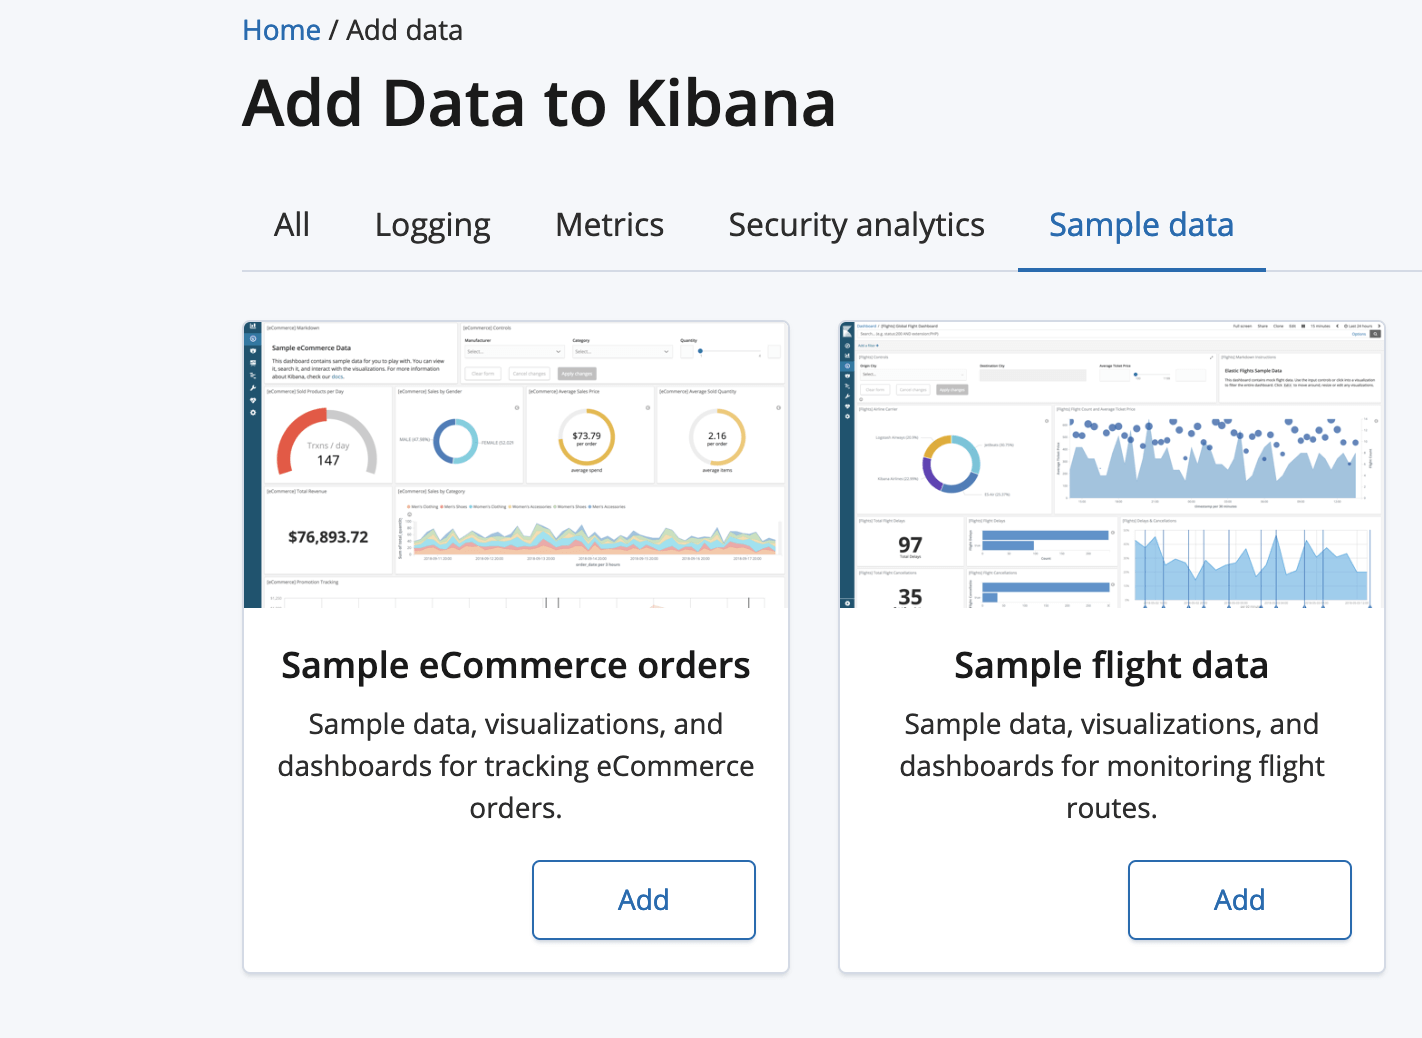
We should now be able to see the loaded data by clicking the “View data” button. The dashboard will be similar to this one.

Now we can test freezing the index:
POST /kibana_sample_data_flights/_forcemerge?max_num_segments=1
POST /kibana_sample_data_flights/_freeze
And if we go back to our dashboard, we’ll notice that the data has apparently “disappeared”.
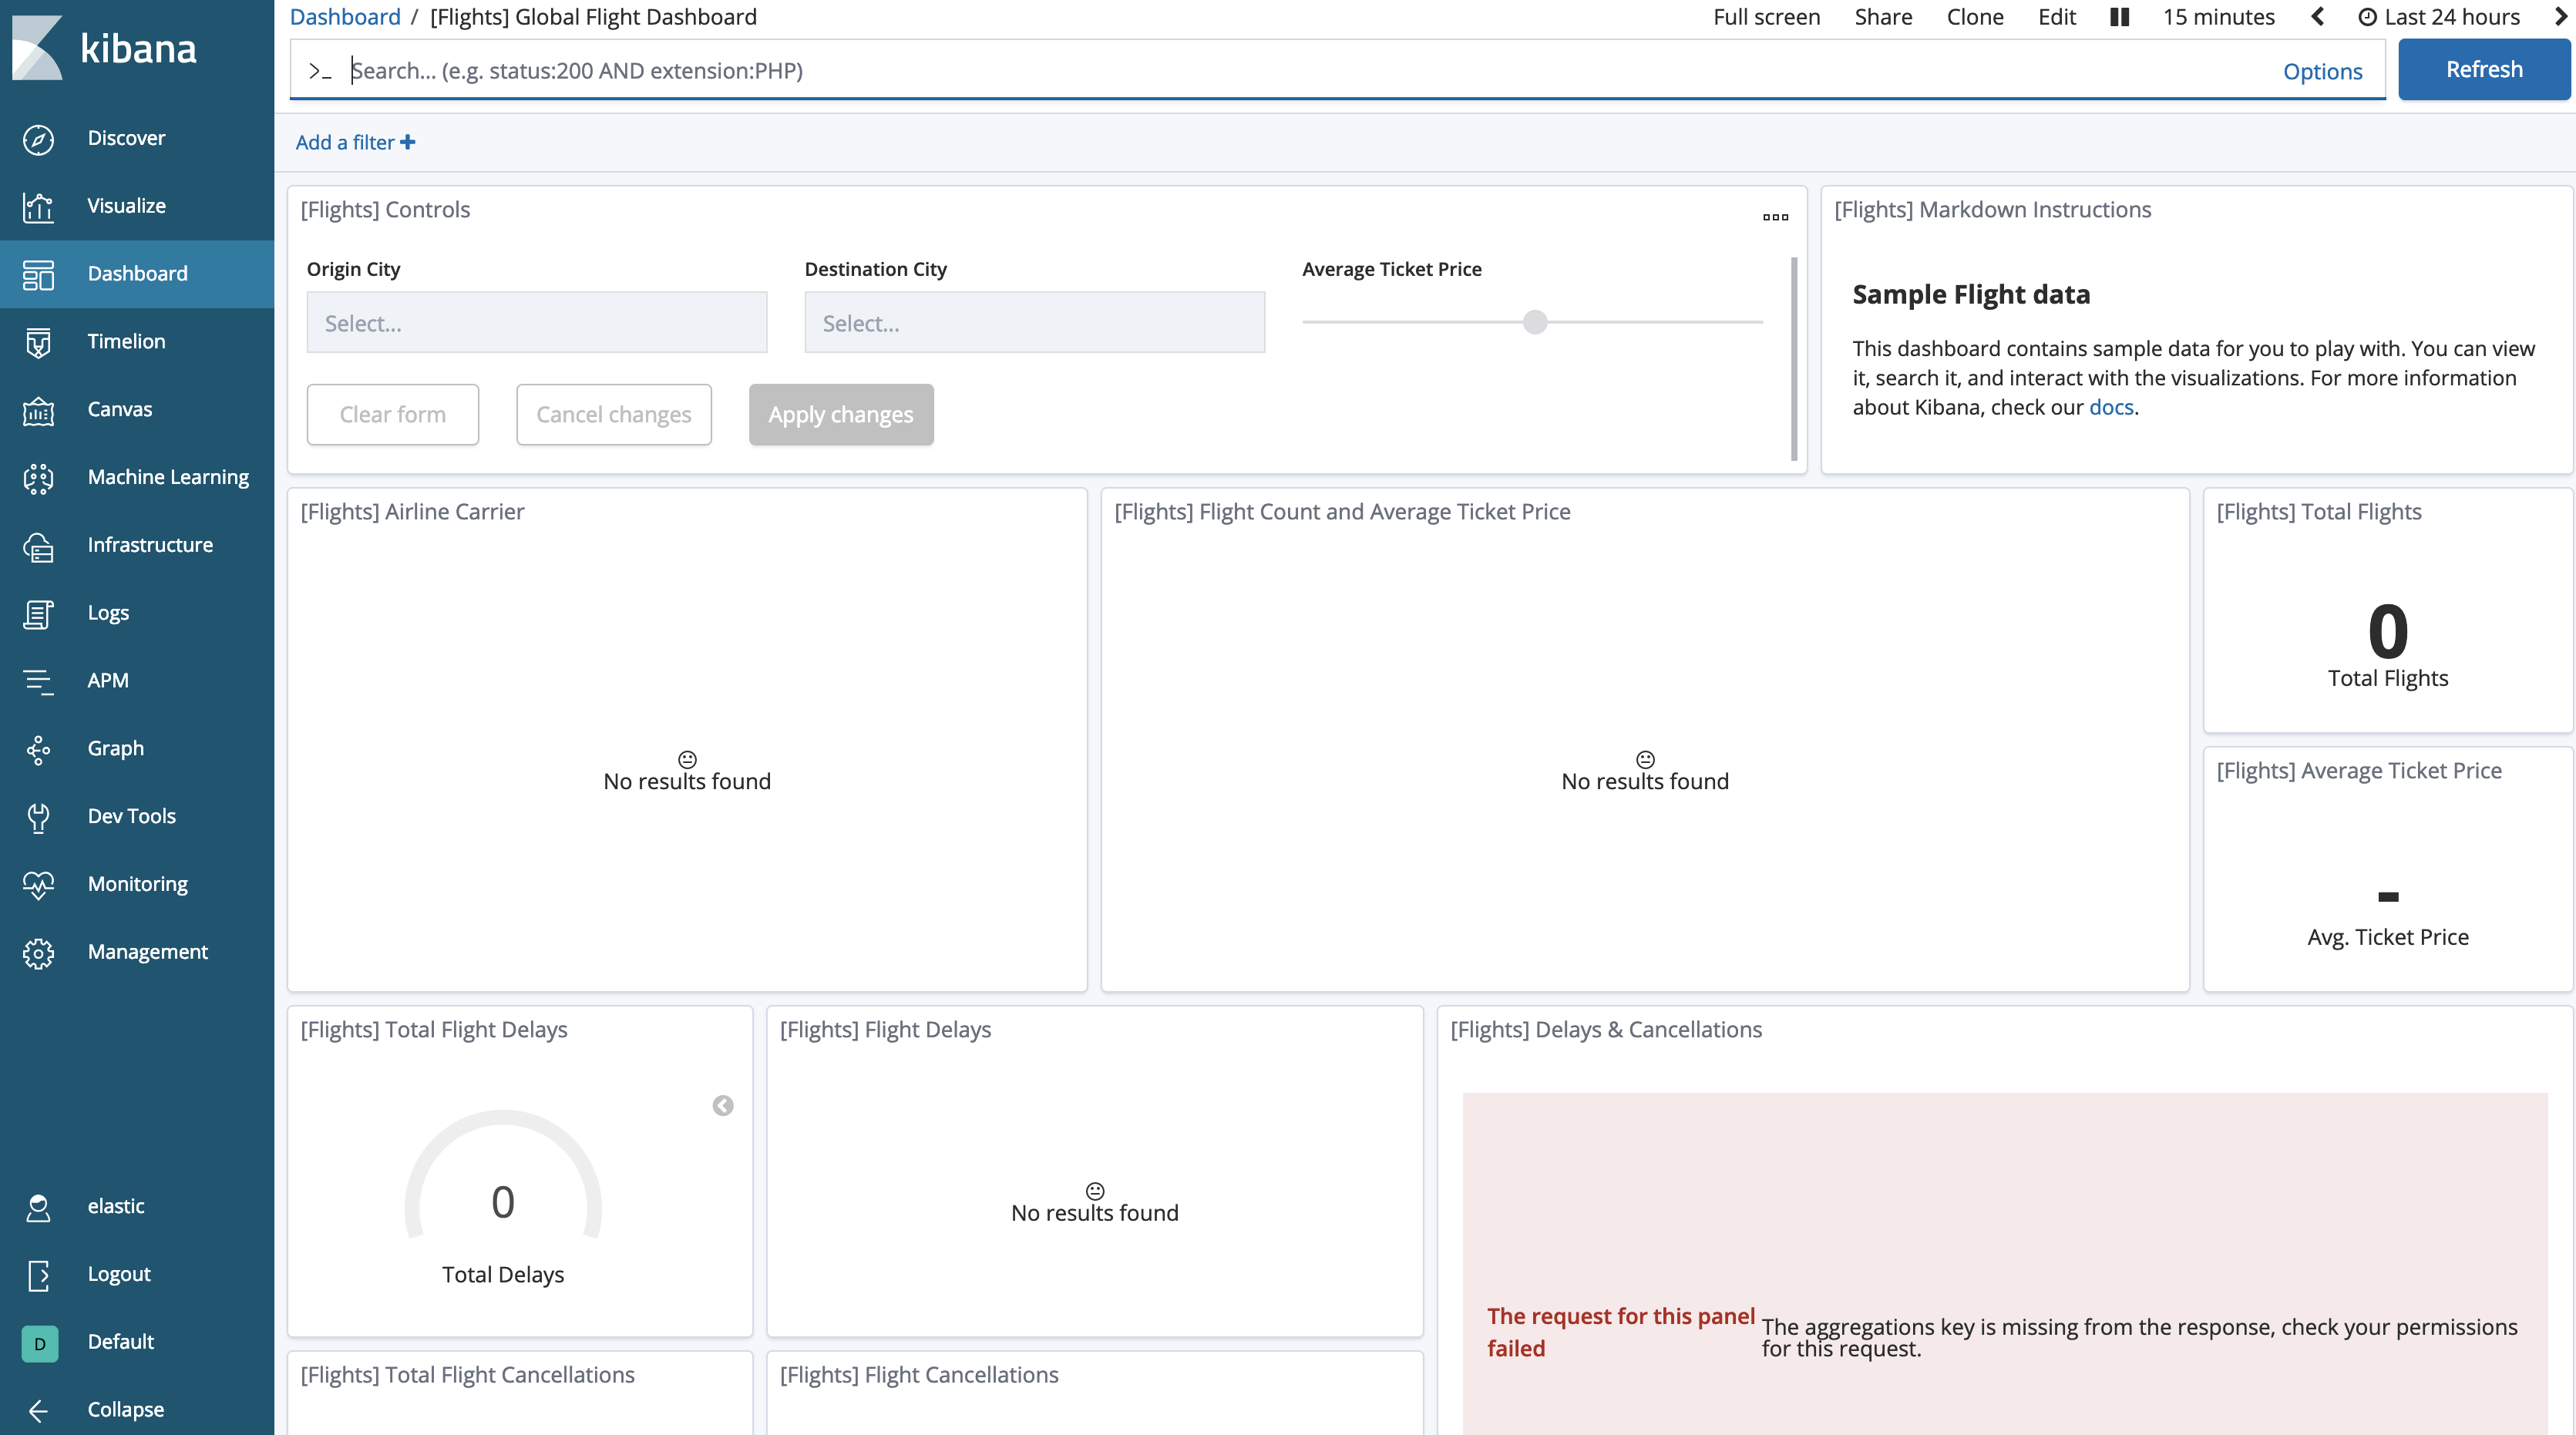
We need to tell Kibana to allow searches on frozen indices, which is disabled by default.
Go to Kibana Management, choose Advanced Settings. In the Search section, you will find that “Search in frozen indices” is disabled. Toggle to enable and save the changes.

And the flight’s dashboard will show the data again.
Wrapping up
Frozen Indices are a very powerful tool in hot-warm architectures. They enable a more cost-effective solution for increased retention while retaining online search. I recommend that you test your search latency with your hardware and data, to come with the right sizing and search latency for your frozen indices.
Check out the Elasticsearch documentation to learn more about the Freeze index API. And as always, if you have any questions, reach out on our Discuss forums. Happy freezing!