Working as an Elastic support engineer, we see a few tools that are very useful to have already in place when we need to help our customers troubleshoot their Elasticsearch clusters, or monitor to keep them healthy. Let’s review the top 3 with a few examples.
1. Know your REST APIs
Knowing Elasticsearch REST APIs is very useful to keep your cluster healthy. Not only can they help you troubleshoot, but prevent issues. If you want something more human-readable, have a look at the CAT APIs.
The first thing to keep the cluster healthy is to keep it in green health. With a simple call to the cluster health API:
GET /_cluster/health
We’ll get an overview of our cluster status.
{
  "cluster_name": "eyeveebee-prod-cluster",
  "status": "red",
  "timed_out": false,
  "number_of_nodes": 30,
  "number_of_data_nodes": 27,
  "active_primary_shards": 15537,
  "active_shards": 26087,
  "relocating_shards": 0,
  "initializing_shards": 0,
  "unassigned_shards": 1,
  "delayed_unassigned_shards": 0,
  "number_of_pending_tasks": 209,
  "number_of_in_flight_fetch": 0,
  "task_max_waiting_in_queue_millis": 235940,
  "active_shards_percent_as_number": 99.99616762873977
}
In the case above, we have a cluster in red status. We can see we have one unassigned shard, which is causing the cluster to be red. The health of a cluster is that of the worst shard of the worst index. Therefore, at least some index or shard will be in red.
It’s important that we keep our cluster in green health. Kibana alerts can help us here, notifying us when the cluster becomes yellow (missing at least one replica shard) or red (missing at least one primary shard).
To further investigate what index is red, we can use the CAT indices API:
GET _cat/indices?v&s=health:desc,index&h=health,status,index,docs.count,pri,rep
Where we could locate the red index.
health status index                    docs.count pri rep
red    open   eventlogs-000007                      1   1
green  open   .apm-agent-configuration          0   1   1
...
With the CAT shards API we can have look at the shards for the red index ‘eventlogs-000007’:
GET _cat/shards?v&s=state:asc,node,index&h=index,shard,prirep,state,docs,node
Where we would be able to determine that indeed we are missing a primary shard, which is ‘UNASSIGNED’.
index                                                                 shard prirep state         docs node
eventlogs-000007                                                      0     p      UNASSIGNED
.apm-agent-configuration                                              0     p      STARTED          0 instance-0000000012
...
Finally, we can use the Cluster Allocation explain API to find the reason why.
GET _cluster/allocation/explain
{
  "index": "eventlogs-000007",
  "shard": 0,
  "primary": true
}
We would get an explanation similar to the following, which should allow us to get to the root cause.
{
  "index" : "eventlogs-000007",
  "shard" : 0,
  "primary" : false,
  "current_state" : "unassigned",
  "unassigned_info" : {
    "reason" : "NODE_LEFT",
    "at" : "2021-12-08T17:00:53.596Z",
    "details" : "node_left [gyv9cseHQyWD-FjLTfSnvA]",
    "last_allocation_status" : "no_attempt"
  },
  "can_allocate" : "no",
  "allocate_explanation" : "cannot allocate because allocation is not permitted to any of the nodes",
  "node_allocation_decisions" : [
    {
      "node_id" : "-PYVqLCLTSKjriA6UZthuw",
      "node_name" : "instance-0000000012",
      "transport_address" : "10.43.1.6:19294",
      "node_attributes" : {
        "xpack.installed" : "true",
        "data" : "hot",
        "transform.node" : "true"
      },
      "node_decision" : "no",
      "deciders" : [
        {
          "decider" : "same_shard",
          "decision" : "NO",
          "explanation" : "the node is above the high watermark cluster setting [cluster.routing.allocation.disk.watermark.high=90.0%], having less than the minimum required [90.0%] free space, actual free: [9.13%]"
        }
      ]
    },
    ...
In this case, we ran out of storage on our nodes and shards cannot be assigned. Something we could further confirm using the CAT allocation API.
We can prevent hitting the disk watermarks with Kibana alerts for disk usage threshold. If we keep our nodes around 75% storage, we will have room for growth and keep our cluster healthier. Starting at 85% storage used (default value), we’ll have shard allocation limitations.
We can’t stress enough the importance of planning for data retention. Index Lifecycle Management and the use of Data Tiers are of great help to keep storage in check. Also good to read the documentation on Size your shards, which is also key in keeping a healthy cluster.
Don’t forget to use Elasticsearch snapshots, with snapshot lifecycle-management, to prepare for scenarios where we could lose data if we have no backup. And to set up for high availability.
We also observe in the cluster health above that the number of pending tasks could be a bit high. And we could further look at those again with a call to the CAT pending tasks API:
GET /_cat/pending_tasks?v
To find out what tasks we have pending.
insertOrder timeInQueue priority source
412717 5.2s NORMAL restore_snapshot[2021.12.17-.ds-logs-2021.12.09-000030-trdkfuewwkjaca]
412718 2s NORMAL ilm-execute-cluster-state-steps [{"phase":"cold","action":"searchable_snapshot","name":"wait-for-index-color"} => {"phase":"cold","action":"searchable_snapshot","name":"copy-execution-state"}]
...
Or we could also use jq to aggregate the results of the pending cluster tasks API to more easily investigate what are the tasks we have pending.
curl --silent --compressed 'https://localhost:9200/_cluster/pending_tasks' | jq '.tasks[].source' -cMr | sed -e 's/\[.*//' | sort | uniq -c
Which could give us a better idea of what is causing pending tasks:
  1 restore_snapshot
 17 delete-index
183 ilm-execute-cluster-state-steps
  2 node-join
  4 update task state
  2 update-settings
This is just to showcase that knowing the REST APIs available we can get very helpful information to assess our cluster’s health and adjust our architecture accordingly.
Finally, have a peek at Elastic’s support diagnostics. Those are the REST APIs calls that we use at Elastic Support to help our customers keep their clusters healthy. Or have a look at our blog “Why does Elastic support keep asking for diagnostic files” which explains the underlying reasons why.
2. Take Advantage of the Stack Monitoring & Alerting
The second recommendation is to plan for a separate monitoring cluster when in production. The REST APIs give us current information, but we are missing the historic data. If we send that to a monitoring cluster, it will help us investigate incidents, forecast capacity, etc.
Kibana alerts for the Elastic Stack monitoring will notify us of potential issues.
One example we see a lot in Elastic support, where monitoring comes in handy, is node hot-spotting.
If we have a cluster that is showing high CPU, let’s say, during ingestion, on one or just a few of the data nodes, while the others are idle; and those nodes keep changing. We can use monitoring to confirm our suspicions.
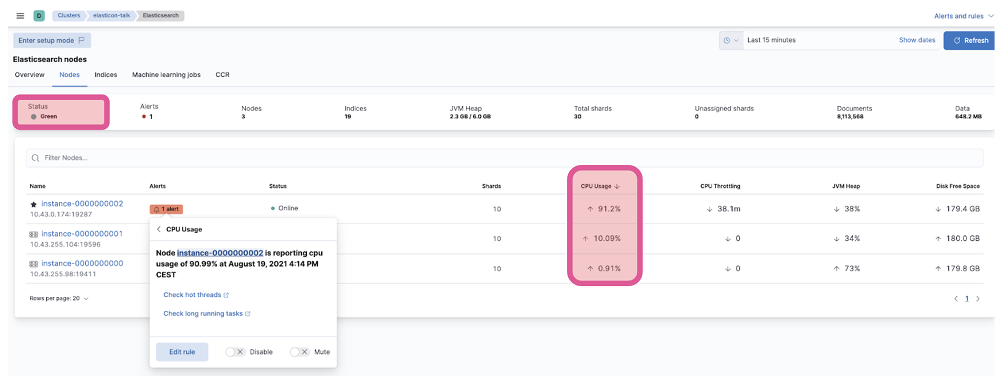
Let’s have a look at the Kibana Stack Monitoring UI for our cluster. Out of 3 nodes, 1 is showing high CPU usage.

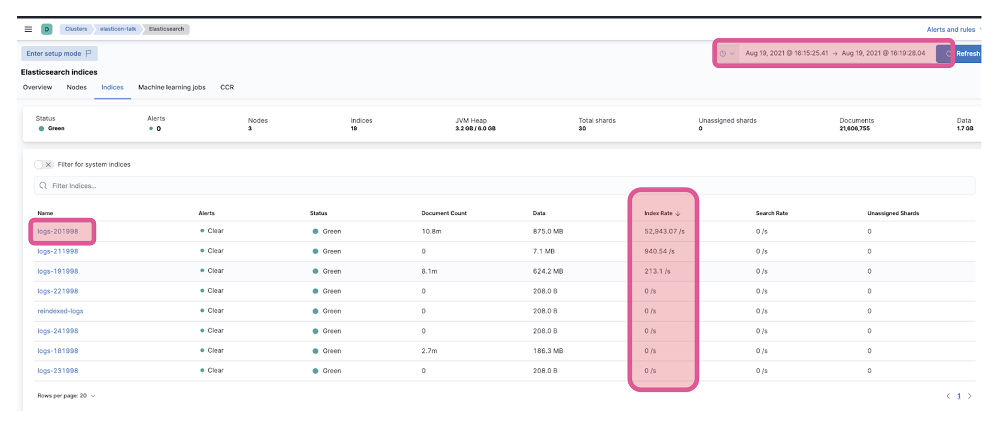
We could investigate further by going to the indices tab. We might find, like in this case, that during the window when we see high CPU usage on one node, we have an index ‘log-201998’ that had a very high ingest rate compared to the rest.

If this index has one primary shard, and it’s the only one with a high ingest rate, we could assign 3 primary shards, so the load is balanced between the 3 data instances we have in this example.
For bigger clusters and more than one hot index, the situation might be not so straightforward. We might need to limit the number of shards for those indices that end up on each cluster node. Check on our docs to avoid node hotspots.
Having a monitoring cluster will be of great help.
3. Proactively check Logs
One last recommendation is to proactively review the logs.
We can use Filebeat’s Elasticsearch module to ingest our logs in the monitoring cluster we discussed in the previous section. And even use the stack capabilities to categorize logs to discover anything abnormal and alert us.
One example we see with our customers a lot is wrong mapping data types in the indices.
Depending on how we configure our index mappings, we might be losing documents that come with conflicting types. If we check our cluster logs, we would see those errors and be able to act.
Let’s take the example of a document that sometimes has a numeric value in the source, and sometimes it’s alphanumeric. If we use the default dynamic mappings, and we first ingest this document with a numeric value of a field we’ll call “key”:
POST my-test-index/_doc
{
  "key": 0
}
Elasticsearch will interpret this field as a number, of type long.
GET my-test-index/_mapping/field/key
{
  "my-test-index" : {
    "mappings" : {
      "key" : {
        "full_name" : "key",
        "mapping" : {
          "key" : {
            "type" : "long"
          }
        }
      }
    }
  }
}
If the next document came with, let’s say, with a UUID:
POST my-test-index/_doc
{
  "key": "123e4567-e89b-12d3-a456-426614174000"
}
In Kibana we would see the error.
{
  "error" : {
    "root_cause" : [
      {
        "type" : "mapper_parsing_exception",
        "reason" : "failed to parse field [key] of type [long] in document with id '4Wtyz30BtaU7QP7QuSQY'. Preview of field's value: '123e4567-e89b-12d3-a456-426614174000'"
      }
    ],
    "type" : "mapper_parsing_exception",
    "reason" : "failed to parse field [key] of type [long] in document with id '4Wtyz30BtaU7QP7QuSQY'. Preview of field's value: '123e4567-e89b-12d3-a456-426614174000'",
    "caused_by" : {
      "type" : "illegal_argument_exception",
      "reason" : "For input string: \"123e4567-e89b-12d3-a456-426614174000\""
    }
  },
  "status" : 400
}
This status code 400 is a non-retriable error, and it means Elasticsearch will not index the document, and clients like Logstash or Agent won’t retry.
If we search for our documents on the index, we only have the first one.
GET my-test-index/_search?filter_path=hits.total,hits.hits._source
{
  "hits" : {
    "total" : {
      "value" : 1,
      "relation" : "eq"
    },
    "hits" : [
      {
        "_source" : {
          "key" : 0
        }
      }
    ]
  }
}
This that we see in Kibana, would appear in our logs too. It’s very common to find this in Logstash (logs we can also ingest using Filebeat’s Logstash module). It could go unnoticed unless we check our logs.
Could not index event to Elasticsearch. {:status=>400, :action=>["index", {:_id=>nil, :_index=>"my-test-index-0000001", :routing=>nil, :_type=>"_doc"}, #<LogStash::Event:0x5662a9f3>], :response=>{"index"=>{"_index"=>"my-test-index-0000001", "_type"=>"_doc", "_id"=>"Qmt6z30BtaU7QP7Q4SXE", "status"=>400, "error"=>{"type"=>"mapper_parsing_exception", "reason"=>"failed to parse field [key] of type [long] in document with id 'Qmt6z30BtaU7QP7Q4SXE'As a bonus, if we ingest logs, we will be ready to discover slow logs in case we need to troubleshoot any search or ingest slowness.


